

The skein console
Use the console to test your graph, inspect its state, and understand why a run succeeded, failed, or paused. It runs alongside your skein-js server at /console/.
Open your project
From your project directory, with skein-js installed and a langgraph.json in place, start the development server:
npx skein devOpen the Console URL printed by the server, usually http://localhost:2024/console/. No separate UI process or account is needed. If you do not have a project yet, follow Your first agent.
With custom authentication, use your normal API key in the connection control, or follow development UI access. If you embed skein-js in your own server, mount the console first; framework adapters do not mount it automatically.
Test your graph
- Open Playground and choose an Assistant. An Assistant is a saved configuration of a graph; each registered graph has one by default. Check the graph ID beneath its name.
- Use Chat when your graph accepts a
messageschannel. Use JSON for structured input, following the selected graph's schema and example. - Enter an input whose expected result you know, then choose Send message or Run input.
- Compare the response or final state with that expected result.
For a scaffolded project, choose echo, send hello, and expect echo: hello. This graph needs no model credentials. For your own graph, use an example from its tests or documented input schema. Sending a message to the echo graph does not test your model-backed graph; select that graph's Assistant to test it separately.
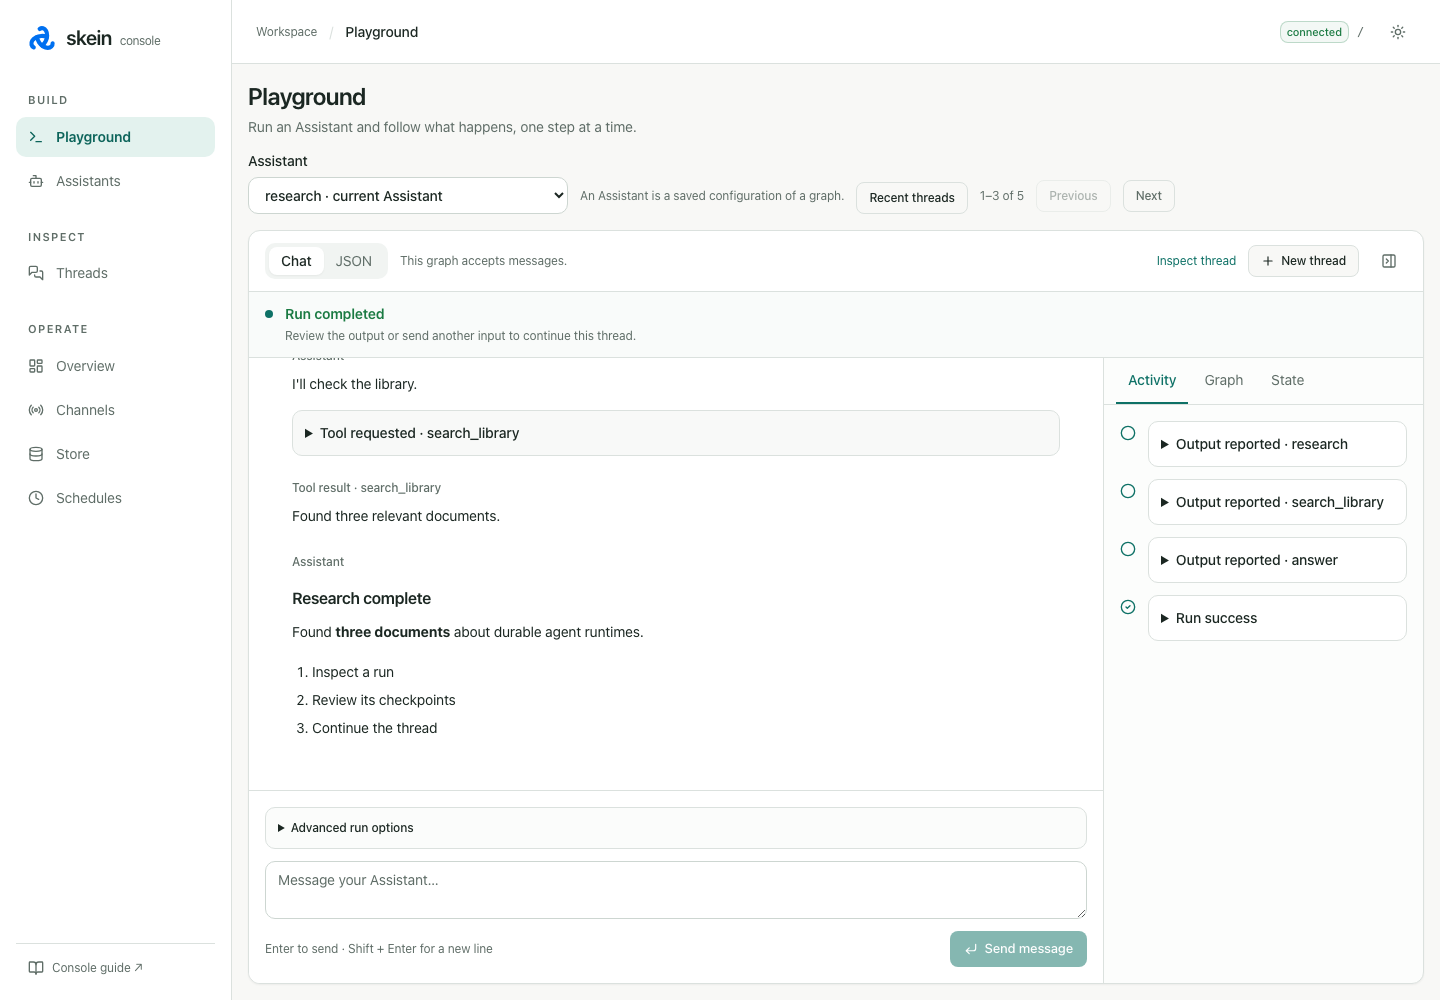
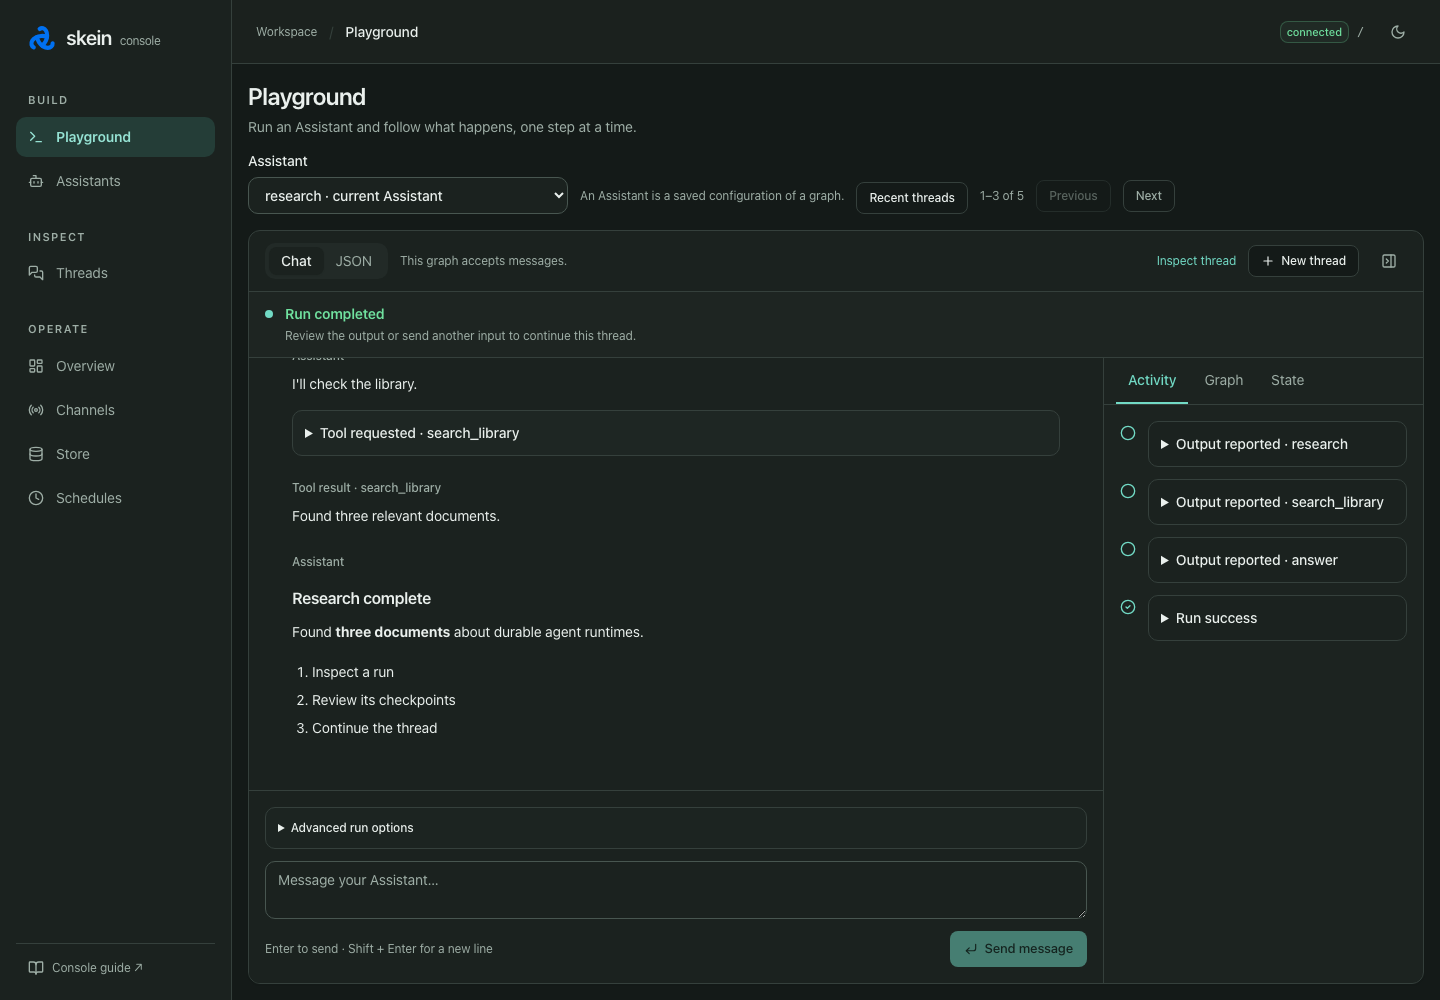
For example, suppose you are testing a support agent. Send “I was charged twice for my order.” Check that it chooses your billing path and looks up the order before drafting a response. If the reply sounds right but the wrong tool ran, inspect Activity and State before changing the prompt. For a structured classifier, submit the same complaint using the fields in its JSON input schema.
Understand the result
The inspector helps you check more than the final answer:
| View | Use it to check |
|---|---|
| Activity | Reported node output, tool calls and results, pauses, and failures |
| State | The latest reported values, including structured output |
| Graph | Which nodes reported output; highlighting does not identify the node executing now |
For a failed run, open the thread's Runs tab and select the run to inspect its activity and raw events. Compare the reported error with the server logs; see Errors & logging. A connection problem and a failed graph execution are different states. After a disconnect or an ambiguous submission error, inspect the thread before sending the input again: the run may already exist.
Stop run requests cancellation on the server. Leaving the page, reloading, or closing an inspection stream does not cancel execution. Reopen the same thread to observe its latest run; opening it does not submit another input.
Try another case
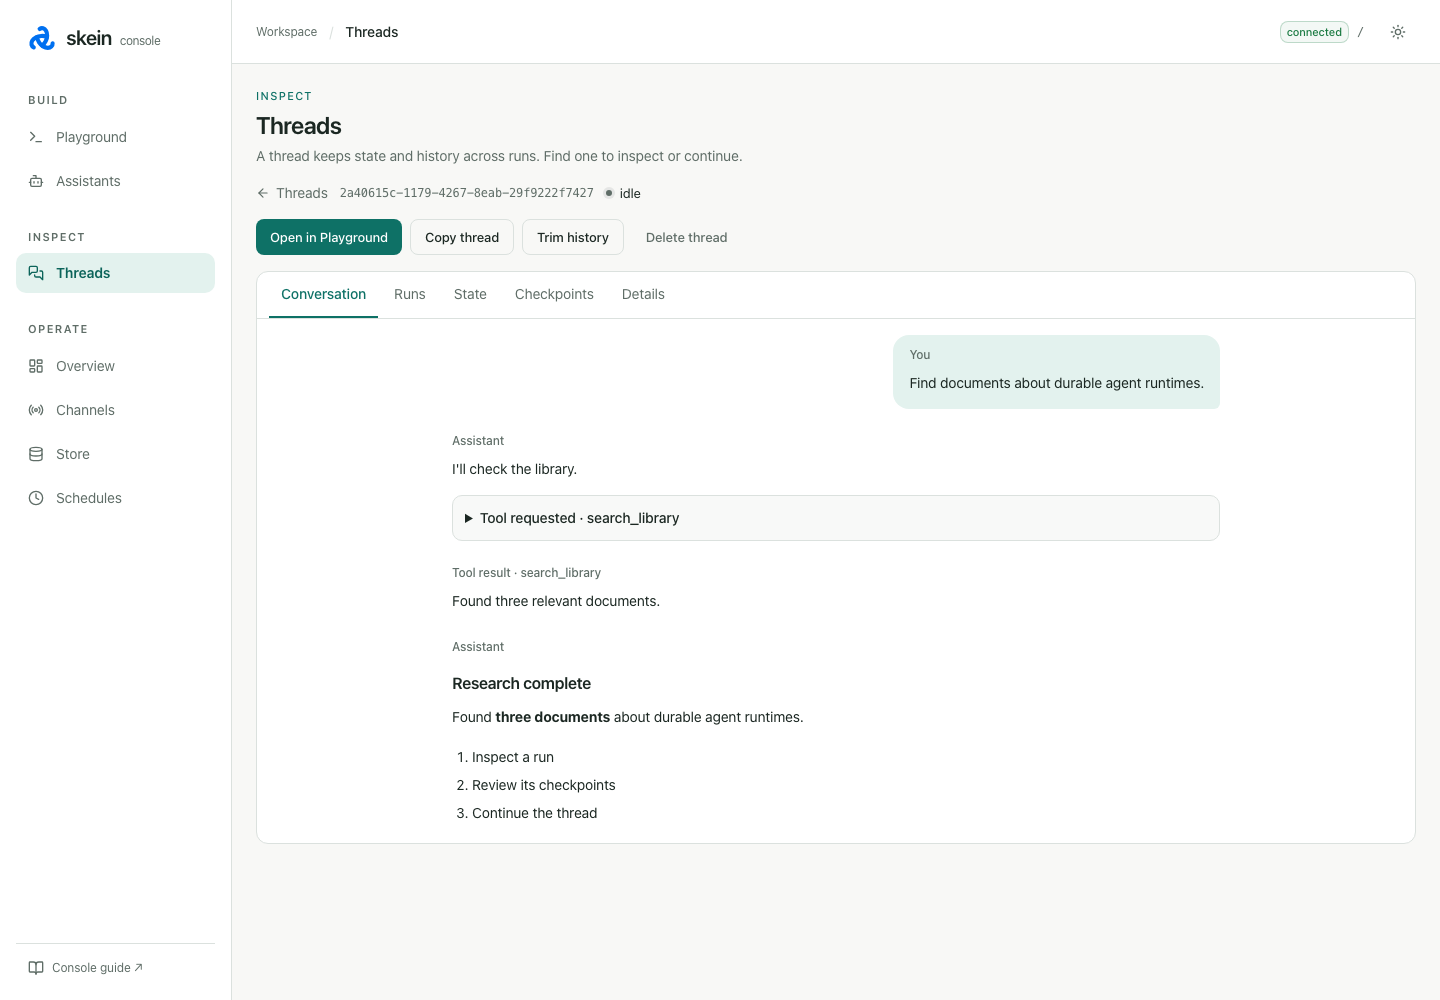
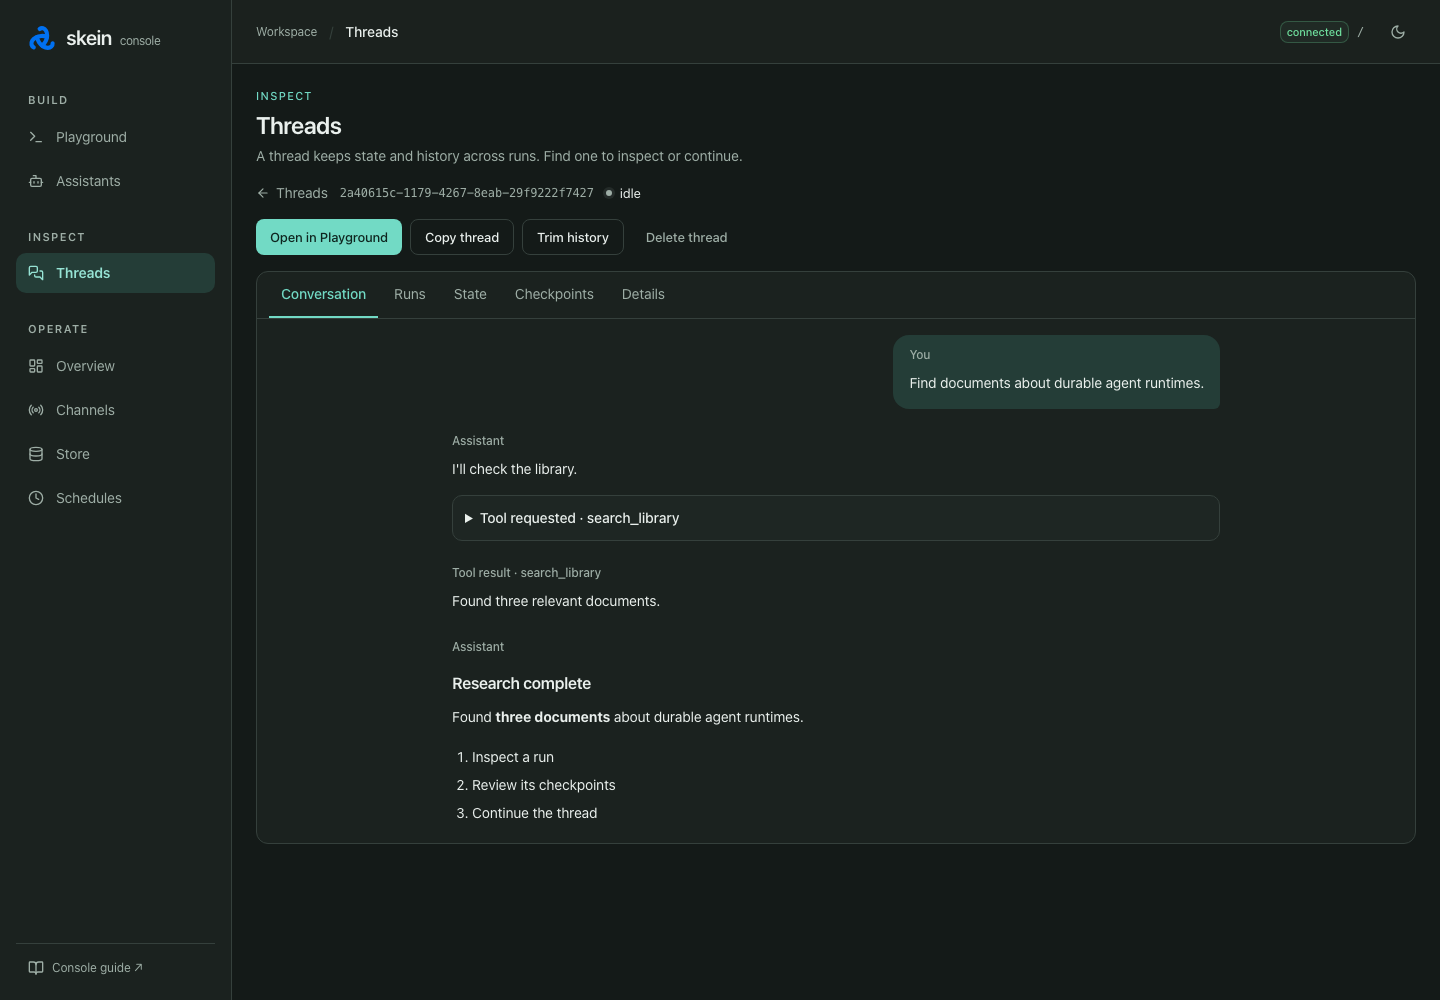
Continue on the same thread to test a conversation with existing state. Choose New thread to test from a fresh conversation. Recent threads, or Threads → Open in Playground, returns you to an earlier conversation. Each thread keeps its own Chat and JSON drafts in this browser tab.
Change your graph and save it to trigger development hot reload, then run a new case. In the echo example, change the reply prefix to you said: and check that a new message uses it. Start a fresh thread when earlier state would affect the result.
Test pauses and alternative paths
If your graph uses human approval, run an input that reaches interrupt(). Read the Waiting for you request and submit the value your graph expects. Send true and Send false send literal booleans; use the editable response for another JSON value. Check that the resumed run follows the intended path. Repeat on a fresh thread with a different response. For a refund workflow, check that approval reaches your test refund tool and rejection leaves the charge untouched.
If the thread has checkpoint history, open Checkpoints to inspect an earlier state:
- Fork here writes your edited values as a new checkpoint.
- Fork and run writes the edits and runs forward.
- Run from here unchanged runs forward from the selected checkpoint.
Edits use your graph's reducers: an append channel adds values rather than replacing its history. Review the selected checkpoint and the reducer warning before running. These actions can execute your tools again; use test inputs and destinations when exploring side effects.
Inspect the rest of your project
Use these screens when your project uses the corresponding capability:
| Task | Where to go |
|---|---|
| Find paused or failed conversations | Overview or filter Threads by status |
| Compare saved graph configurations | Assistants; see Assistant versions |
| Check long-term memory | Store; see memory and storage |
| Check when a scheduled run should fire | Schedules; see cron schedules |
| Inspect configured inbound routes | Channels; changes are made in code/configuration |
| Diagnose a run's outbound delivery | The run's Deliveries tab; see delivery and replay |
Lists refresh on demand; observed runs stream live. Overview's recent activity covers recent threads, not every run on the server. For server-wide queries, use run search.
The console operates on your connected server's real resources with your permissions. Store writes, schedule changes, deletion, and delivery replay affect that server. It does not edit graph code or manage your application's permissions.
Make your checks repeatable
The console is useful for exploring an input and diagnosing a result. Turn important cases into automated project tests so you can check them after future changes.
Optional walkthrough
This silent recording uses offline demo graphs to show running an Assistant, inspecting its thread, and returning to Playground. The steps above work with your own registered graphs.
Setup reference
See the console setup reference for connections, authentication, production enablement, manual mounting, and advanced run options.